A Shiny New Pyramid...
I’d like to talk to about pyramids today.

Part of my research work at PSU entails looking at ACS/Census/LODES/LEHD data to suss out broader trends that will change the way we plan our urban growth and shape our policies.
Alright, a lot of my work is doing that, actually. And so, eventually I got to the point where I wanted to have a tool to get a quick snapshot of some essential data points from an area, with a degree of interactivity that allows for unusual geography selection. Anyone who’s known me for the last few years knows I’ve been on a serious R kick, and so they won’t be surprised to hear that the solution I came up with is centered around R and Shiny!
If you want to stop reading my blather and play around with the app, go here. Otherwise, keep reading for the background.
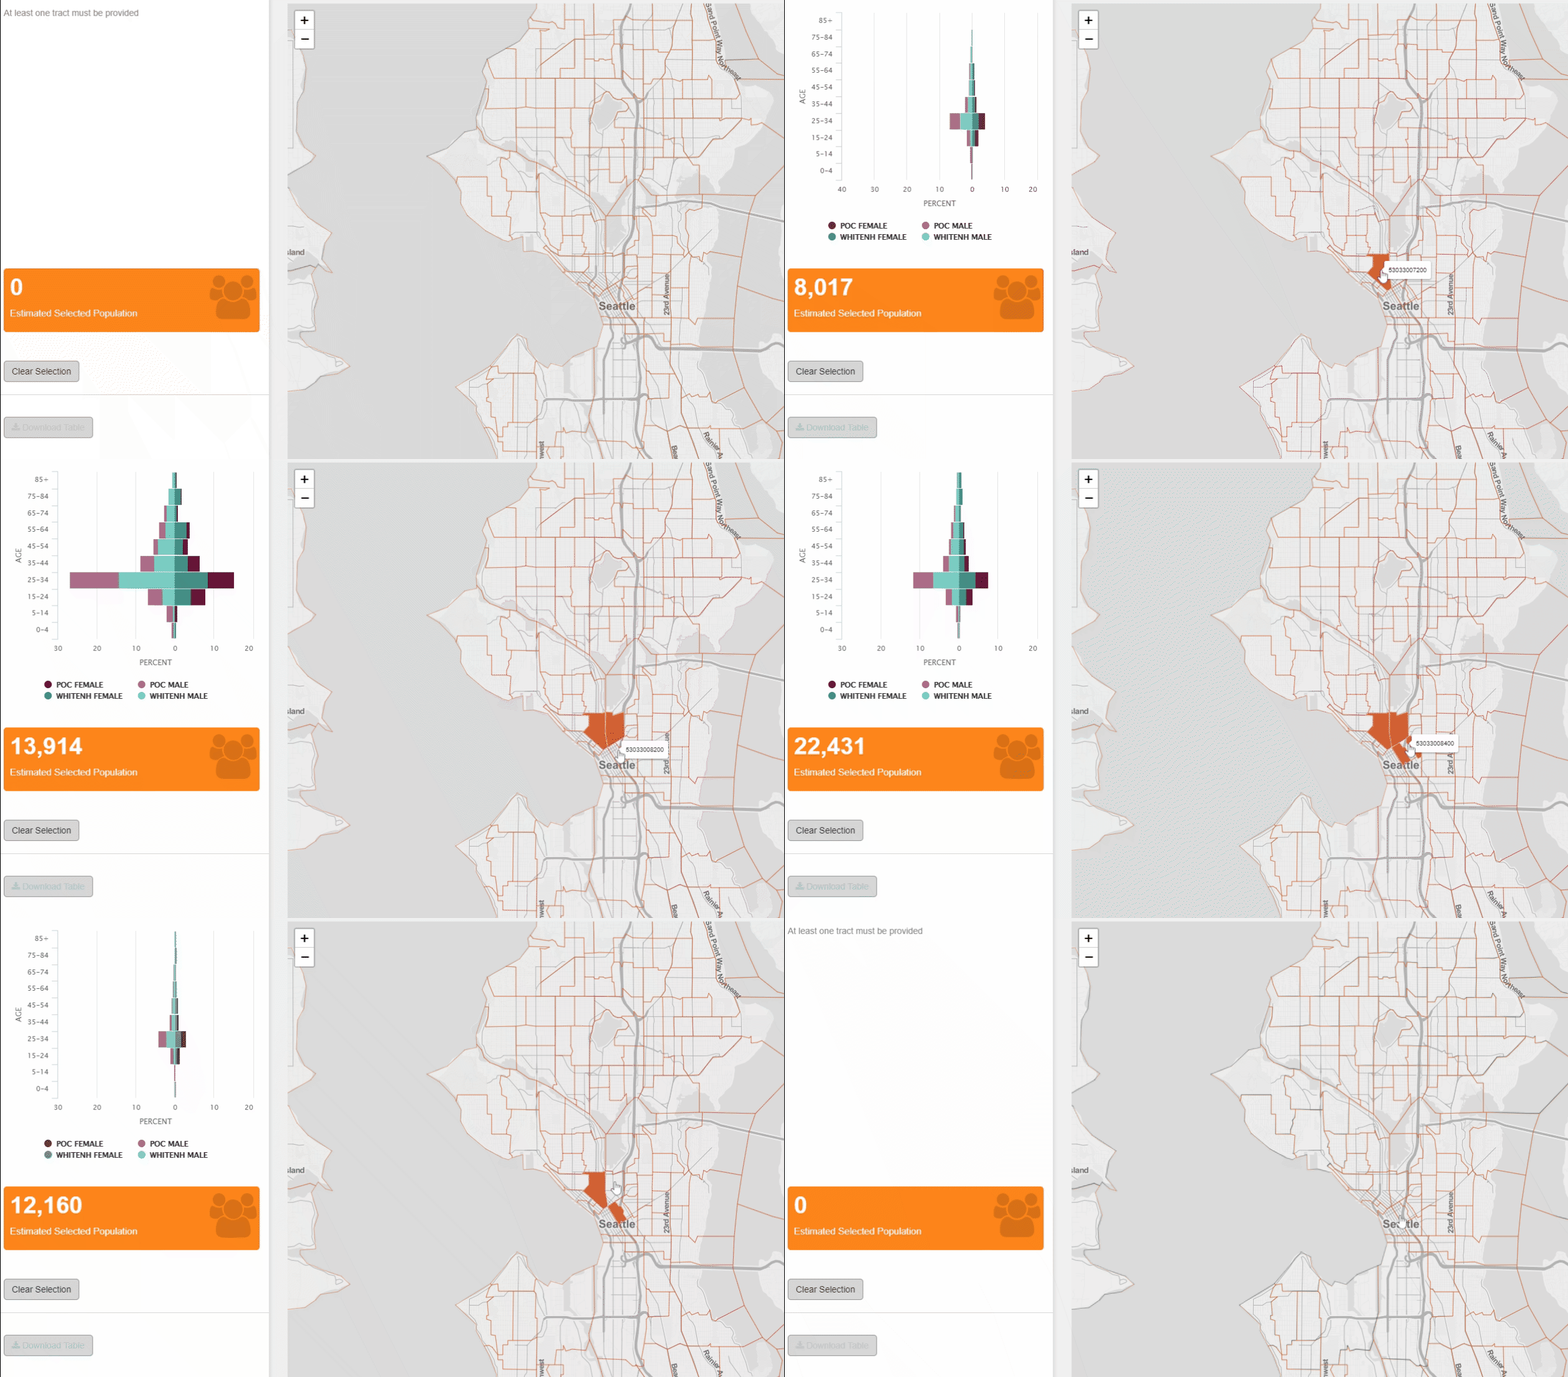
The central concept of the app was to have an interactive web map of census tracts, where I would be able to select - and most importantly, DESELECT - census tracts by simply clicking anywhere in the polygon.
Easier said than done!
Turns out, Shiny is very specific about lists of selected items and it took a kind of hacky-ish mechanism to create the select/deselect protocol. On top of that, I wanted the selected polygons to be feed into a population table summary that spat out a population pyramid with stacked POC/White non-hispanic populations. After a few attempts over the course of a month, and a redesign to use shinydashboard, I finally got the app to where I wanted.

All credit for the select/deselect code goes to Stackoverflow user “lauren” for detailing their methods in a post from 2016, which I was able to (almost painlessly) port into my app as seen below:
observeEvent(input$map_shape_click, {

    click <- input$map_shape_click

    trl$clicks <- c(trl$clicks, click$id)

    clicked_tracts <- tracts[tracts$GEOID %in% trl$clicks, ]

    #if the current click ID exists in the clicked polygon (if it has been clicked twice)
    if(click$id %in% clicked_tracts$GEOID2){

      #create a vector that subsets NAME that matches GEOID2 to click ID
      nameMatch <- clicked_tracts$GEOID[clicked_tracts$GEOID2 == click$id]

      #remove the current click$id AND its name match from the clicked_tracts shapefile
      trl$clicks <- trl$clicks[!trl$clicks %in% click$id]
      trl$clicks <- trl$clicks[!trl$clicks %in% nameMatch]

      #remove that highlighted polygon from the map
      leafletProxy("map") %>%
        removeShape(layerId = click$id)

    } else {

      #map highlighted polygons
      leafletProxy("map") %>% addPolygons(data = clicked_tracts,
                                          fillColor = "#d36135",
                                          fillOpacity = 1,
                                          weight = 1,
                                          color = "#ffffff",
                                          group = "selected",
                                          label = clicked_tracts$GEOID,
                                          layerId = clicked_tracts$GEOID2)
    } #END CONDITIONAL
Wow! What a fun little trick that ends up creating an interactive experience that’s almost game-like in the way you add and remove tracts from your selection while see the pyramid recompute the cohorts in real-time. Further credit for the pyramid construction is directed to Kyle Walker’s indispensible tidycensus package and his methods posted on his amazing blog that everyone should check out (but sadly seems to be in hibernation).
Further plans for the app are to include a few more auto-computed metrics such as median income, maybe commute modes, and home values (?). Stay tuned…